Local government elections in Tyne and Wear, England
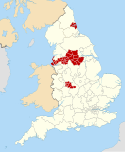
North Tyneside Metropolitan Borough Council elections are generally held three years out of every four, with a third of the council being elected each time. North Tyneside Borough Council, generally known as North Tyneside Council is the local authority for the metropolitan borough of North Tyneside in Tyne and Wear, England. Since 2002 the borough has been led by the directly elected Mayor of North Tyneside.
Council elections
Results maps
-
2018 results map
-
2019 results map
-
2021 results map
-
2022 results map
-
2023 results map
Mayoral elections
By-election results
St Mary's by-election, 1 May 1997
St Mary's by-election 1 May 1997 | Party | Candidate | Votes | % | ±% |
| | Conservative | Ian Gordon | 3,434 | 56.4 | -5.7 |
| | Labour | | 1,752 | 28.8 | +1.0 |
| | Liberal Democrats | | 785 | 12.9 | +2.7 |
| | UKIP | | 113 | 1.9 | +1.9 |
| Majority | 1,682 | 27.6 | |
| Turnout | 6,084 | | |
| | Conservative hold | Swing | | |
Holystone by-election, 22 May 1997
Holystone by-election 22 May 1997 | Party | Candidate | Votes | % | ±% |
| | Labour | | 1,354 | 59.3 | |
| | Conservative | | 481 | 21.1 | |
| | Liberal Democrats | | 373 | 16.3 | |
| | Independent | | 76 | 3.3 | |
| Majority | 873 | 38.2 | |
| Turnout | 2,284 | 23.8 | |
| | Labour hold | Swing | | |
Valley by-election, 26 November 1998
Valley by-election 26 November 1998 | Party | Candidate | Votes | % | ±% |
| | Labour | | 903 | 64.7 | |
| | Conservative | | 341 | 24.4 | |
| | Liberal Democrats | | 151 | 10.8 | |
| Majority | 562 | 40.3 | |
| Turnout | 1,395 | 19.5 | |
| | Labour hold | Swing | | |
Riverside by-election, 11 March 1999
Riverside by-election 11 March 1999 | Party | Candidate | Votes | % | ±% |
| | Labour | | 692 | 79.6 | -3.2 |
| | Conservative | | 177 | 20.4 | +3.2 |
| Majority | 515 | 59.2 | |
| Turnout | 869 | 13.0 | |
| | Labour hold | Swing | | |
St Mary's by-election, 27 June 2002
St Mary's by-election 27 June 2002 | Party | Candidate | Votes | % | ±% |
| | Conservative | Pam McIntyre | 2,019 | 83.2 | +11.1 |
| | Labour | | 210 | 8.7 | -3.6 |
| | Liberal Democrats | | 198 | 8.2 | -7.4 |
| Majority | 1,809 | 74.5 | |
| Turnout | 2,427 | 33.0 | |
| | Conservative hold | Swing | | |
Seatonville by-election, 27 June 2002
Seatonville by-election 27 June 2002 | Party | Candidate | Votes | % | ±% |
| | Conservative | Ken Mewett | 1,610 | 58.4 | +10.8 |
| | Liberal Democrats | | 632 | 22.9 | -5.4 |
| | Labour | | 476 | 17.3 | -6.8 |
| | Independent | | 40 | 1.5 | +1.5 |
| Majority | 978 | 35.5 | |
| Turnout | 2,758 | 38.0 | |
| | Conservative hold | Swing | | |
Tynemouth by-election, 14 August 2003
Tynemouth by-election 14 August 2003 | Party | Candidate | Votes | % | ±% |
| | Conservative | | 1,533 | 73.2 | +6.4 |
| | Labour | | 562 | 26.8 | -6.4 |
| Majority | 971 | 46.4 | +12.7 |
| Turnout | 2,095 | 30.8 | -1.1 |
| | Conservative hold | Swing | +6.4 | |
Weetslade by-election, 23 June 2005
Weetslade by-election 23 June 2005 | Party | Candidate | Votes | % | ±% |
| | Conservative | Duncan McLellan | 1,177 | 46.7 | +3.1 |
| | Labour | | 998 | 39.6 | -7.5 |
| | Liberal Democrats | | 347 | 13.7 | +4.5 |
| Majority | 179 | 7.1 | |
| Turnout | 2,522 | 26.8 | -18.42 |
| | Conservative gain from Labour | Swing | +5.3 | |
Preston by-election, 6 October 2005
Preston by-election 6 October 2005 | Party | Candidate | Votes | % | ±% |
| | Conservative | Linda Arkley | 1,458 | 62.7 | +3.2 |
| | Labour | Dan Jackson | 722 | 31 | -2.8 |
| | Liberal Democrats | | 146 | 6.3 | -1.4 |
| Majority | 736 | 31.7 | |
| Turnout | 2,326 | 34.1 | -8.47 |
| | Conservative hold | Swing | +3 | |
Benton by-election, 28 September 2006
Benton by-election 28 September 2006 | Party | Candidate | Votes | % | ±% |
| | Conservative | Patricia Greenwell | 1,359 | 49.2 | +2.5 |
| | Labour | Joanne Cassidy | 1,191 | 43.2 | +5.7 |
| | Liberal Democrats | Sarah Richards | 210 | 7.6 | -8.2 |
| Majority | 168 | 6.0 | |
| Turnout | 2,760 | 35.7 | -8.9 |
| | Conservative hold | Swing | -1.6 | |
St Mary's by-election, 5 July 2007
St Mary's by-election 5 July 2007 | Party | Candidate | Votes | % | ±% |
| | Conservative | Judith Wallace | 1,992 | 76.79 | +3.15 |
| | Labour | Margaret Hall | 363 | 13.99 | +2.27 |
| | Liberal Democrats | David Banks | 239 | 9.21 | -5.43 |
| Majority | 1,629 | 62.8 | +3.8 |
| Turnout | 2,594 | 37.6 | -17.4 |
| | Conservative hold | Swing | +0.44 | |
Monkseaton North by-election, 19 June 2008
Monkseaton North by-election 19 June 2008 | Party | Candidate | Votes | % | ±% |
| | Conservative | Leslie Miller | 1,617 | 69.6 | +1.8 |
| | Labour | Glenn Stillaway | 413 | 17.8 | -1.5 |
| | Liberal Democrats | Eleanor Jellett | 198 | 8.5 | -4.4 |
| | Green | Martin Collins | 94 | 4.0 | +4.0 |
| Majority | 1,204 | 51.9 | +3.5 |
| Turnout | 2,322 | 34.1 | -11.1 |
| | Conservative hold | Swing | +3.3 | |
Tynemouth by-election, 5 February 2009
Tynemouth by-election 5 February 2009 | Party | Candidate | Votes | % | ±% |
| | Conservative | David Wallace Lilly | 1,538 | 62.2 | -5.4 |
| | Labour | Jane Shaw | 701 | 28.4 | -4 |
| | Liberal Democrats | John Lewis Webb | 233 | 9.4 | +9.4 |
| Majority | 837 | 33.9 | -1.4 |
| Turnout | 2,472 | 30.1 | -12.6 |
| | Conservative hold | Swing | -0.7 | |
Preston by-election, 24 September 2009
Preston by-election, 24 September 2009[1] | Party | Candidate | Votes | % | ±% |
| | Conservative | David Sarin | 1,141 | 55.8 | -14.2 |
| | Labour | Kate Osborne | 503 | 24.6 | -5.3 |
| | Public Services not Private Profit | William Burnett | 174 | 8.5 | +8.5 |
| | Liberal Democrats | John Appleby | 152 | 7.4 | +7.4 |
| | Green | Susannah Rutherford | 73 | 3.6 | +3.6 |
| Majority | 638 | 31.2 | -8.9 |
| Turnout | 2,043 | 29.8 | -10.2 |
| | Conservative hold | Swing | -4.5 | |
Battle Hill by-election, 30 September 2010
Battle Hill by-election 30 September 2010 | Party | Candidate | Votes | % | ±% |
| | Labour | Lesley Spillard | 1,334 | 58 | +11.2 |
| | Liberal Democrats | Dorothy Bradley | 826 | 35.9 | -1.5 |
| | Conservative | Wendy Morton | 97 | 4.2 | -5.6 |
| | Independent | Dan Ellis | 46 | 2 | +2 |
| Majority | 508 | 22.1 | +16.7 |
| Turnout | 2,300 | 28.2 | -33 |
| | Labour hold | Swing | +6.4 | |
Wallsend by-election, 16 November 2012
Wallsend by-election 16 November 2012 | Party | Candidate | Votes | % | ±% |
| | Liberal Democrats | Michael Huscroft | 1,158 | 58.2 | +10.4 |
| | Labour | Ron Bales | 693 | 34.8 | -13.2 |
| | Conservative | Barbara Bake | 72 | 3.6 | -0.6 |
| | Green | Martin Collins | 66 | 3.3 | +3.3 |
| Majority | 465 | 23.4 | +23.2 |
| Turnout | 1,989 | 25.6 | -3.7 |
| | Liberal Democrats gain from Labour | Swing | +11.8 | |
Riverside by-election, 4 July 2013
Riverside by-election 4 July 2013 | Party | Candidate | Votes | % | ±% |
| | Labour | Wendy Lott | 1,067 | 85.6 | +1 |
| | Conservative | Barbara Ellen Stevens | 179 | 14.4 | -1 |
| Majority | 888 | 71.3 | +2.1 |
| Turnout | 1,246 | 15.7 | -9.4 |
| | Labour hold | Swing | +1 | |
Camperdown by-election, 9 September 2021
Camperdown by-election 9 September 2021[2] | Party | Candidate | Votes | % | ±% |
| | Labour | Tracy Hallway | 957 | 66.7 | |
| | Conservative | David Lilly | 352 | 24.5 | |
| | Green | Martin Collins | 78 | 5.4 | |
| | Liberal Democrats | Nathan Shone | 38 | 3.3 | |
| Majority | 605 | 42.2 | |
| Turnout | 1,435 | | |
| | Labour hold | Swing | | |
Camperdown by-election, 14 July 2022
Camperdown by-election 14 July 2022[3] | Party | Candidate | Votes | % | ±% |
| | Labour | Peter Earley | 873 | 59.0 | |
| | Conservative | Haylee Josendale | 388 | 26.2 | |
| | Liberal Democrats | Jay Beyer | 124 | 8.4 | |
| | Green | Michael Newton | 58 | 3.9 | |
| | UKIP | Jack Thomson | 36 | 2.4 | |
| Majority | 485 | 32.8 | |
| Turnout | 1,479 | | |
| | Labour hold | Swing | | |
References
- ^ "Tories hold North Tyneside Preston seat". News Guardian. 28 September 2009. Archived from the original on 21 February 2014. Retrieved 28 September 2009.
- ^ "Local Elections Archive Project — Camperdown Ward". www.andrewteale.me.uk. Retrieved 19 April 2022.
- ^ "Local Elections Archive Project — Camperdown Ward". www.andrewteale.me.uk. Retrieved 24 December 2022.
External links
- North Tyneside Metropolitan Borough Council
|
|---|
| Districts | | |
|---|
| Councils | |
|---|
| Local elections | |
|---|
 2018 results map
 2019 results map
 2021 results map
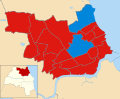 2022 results map
 2023 results map


 Council elections in Tyne and Wear