2012 U.S. presidential election |
|---|
| | | Democratic Party |
|---|
| | | Republican Party |
|---|
| | | | | Related races |
|---|
| | | | |
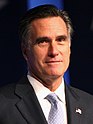
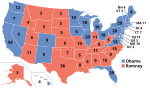
The 2012 Delaware Republican presidential primary took place on April 24, 2012.[2][3] | Key: | Withdrew prior to contest | General election Candidate ballot access - Mitt Romney/Paul Ryan, Republican
- Barack Obama/Joseph Biden, Democratic
- Gary Johnson/James P. Gray, Libertarian
- Jill Stein/Cheri Honkala, Green
Write-in candidate access: - Rocky Anderson/Luis J. Rodriguez, Justice
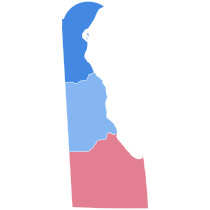
Results By county | County | Barack Obama
Democratic | Mitt Romney
Republican | Various candidates
Other parties | Margin | Total votes cast | | # | % | # | % | # | % | # | % | | Kent | 35,527 | 51.73% | 32,135 | 46.79% | 1,018 | 1.48% | 3,392 | 4.94% | 68,680 | | New Castle | 167,082 | 66.30% | 81,230 | 32.23% | 3,700 | 1.47% | 85,852 | 34.07% | 252,012 | | Sussex | 39,975 | 42.88% | 52,119 | 55.90% | 1,135 | 1.22% | -12,144 | -13.02% | 93,229 | | Totals | 242,584 | 58.61% | 165,484 | 39.98% | 5,853 | 1.41% | 77,100 | 18.63% | 413,921 | By congressional district Due to the state's low population, only one congressional district is allocated. This district is called the At-Large district, because it covers the entire state, and thus is equivalent to the statewide election results. | District | Romney | Obama | Representative | | At-large | 39.98% | 58.61% | John Carney | See also References - ^ "Delaware Democratic Delegation 2012". www.thegreenpapers.com. Retrieved October 30, 2020.
- ^ "Primary and Caucus Printable Calendar". CNN. Retrieved January 11, 2012.
- ^ "Presidential Primary Dates" (PDF). Federal Election Commission. Retrieved January 23, 2012.
- ^ State of Delaware official election results
- ^ "Official General Election Results". State of Delaware. November 7, 2012. Retrieved November 7, 2012.
External links - The Green Papers: for Delaware
- The Green Papers: Major state elections in chronological order
|
|---|
| General | - 1948
- 1950
- 1952
- 1954
- 1956
- 1958
- 1960
- 1962
- 1964
- 1966
- 1968
- 1970
- 1972
- 1974
- 1976
- 1978
- 1982
- 1986
- 1988
- 1990
- 1992
- 1994
- 1996
- 1998
- 2000
- 2002
- 2004
- 2006
- 2008
- 2010
- 2012
- 2014
- 2016
- 2018
- 2020
- 2022
|
|---|
| Del. Senate | |
|---|
| Del. House | |
|---|
| Governor | |
|---|
| U.S. President | |
|---|
U.S. Senate
Class 1 | |
|---|
U.S. Senate
Class 2 | |
|---|
| U.S. House | |
|---|
|
|---|
U.S.
President | |
|---|
U.S.
Senate | |
|---|
U.S.
House
(Election
ratings) | |
|---|
| Governors | |
|---|
Attorneys
general | |
|---|
Other
statewide
elections | |
|---|
State
legislatures | - Arizona
- California
- Connecticut
- Delaware
- Florida
- Hawaii
- Illinois
- Iowa
- Michigan
- Minnesota
- Montana
- New Mexico
- New York
- North Carolina
- Oregon
- Pennsylvania
- Texas
- Washington
- Wisconsin
|
|---|
| Mayoral | - Alexandria, VA
- Anchorage, AK
- Augusta, GA
- Austin, TX
- Bakersfield, CA
- Baton Rouge, LA
- Cheyenne, WY
- Corpus Christi, TX
- Fort Lauderdale, FL
- Fresno, CA
- Glendale, AZ
- Honolulu, HI
- Huntsville, AL
- Irvine, CA
- Juneau, AK
- Lubbock, TX
- Mesa, AZ
- Miami-Dade County, FL
- Milwaukee, WI
- Orlando, FL
- Portland, OR
- Richmond, VA
- Riverside, CA
- Sacramento, CA
- San Diego, CA
- San Juan, PR
- Santa Ana, CA
- Scottsdale, AZ
- Stockton, CA
- Virginia Beach, VA
- Wilmington, DE
|
|---|
States and
territories | |
|---|
|
|---|
| - See also
- Presidential elections
- Senate elections
- House elections
- Gubernatorial elections
|
|
|---|
| | Democratic Party | |
|---|
| Republican Party | |
|---|
| Libertarian Party | |
|---|
| Green Party | |
|---|
| |
|
|---|
| Election timelines | |
|---|
| National opinion polling | |
|---|
| State opinion polling | |
|---|
| Fundraising | |
|---|
| Debates and forums | |
|---|
| Straw polls | |
|---|
| Major events | |
|---|
Caucuses
and primaries | |
|---|
| Results breakdown | |
|---|
National
conventions | |
|---|
| Reforms | |
|---|

|
|

 County Results
 State House Results